
 My 2020 article on the Political Colour Wheel has proven to be one of the most popular on this blog, so today I thought I’d try another idea in that vein.
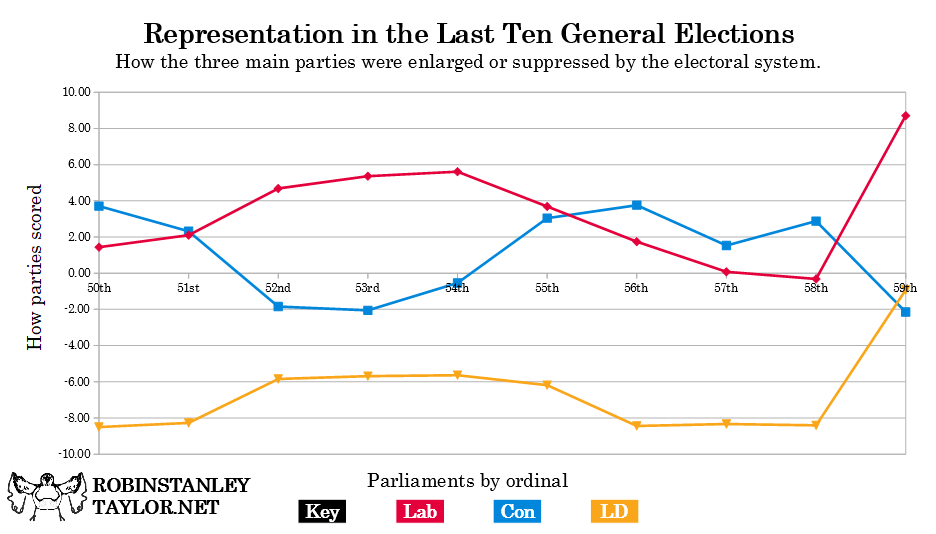
The results of this month’s general election have generated another series of discussions about proportionality, given the historically-low vote share on which Sir Keir Starmer’s party has ridden to victory. I have put together a graph showing how far the Conservative, Labour and Liberal Democratic parties have risen or fallen above or below the waterline at the last ten general elections.
The data themselves are scraped off Wikipedia. I have cheated a little by backdating the name “Liberal Democrat” to 1987, when it was still the alliance between the old Liberal Party and the Social Democrats under Davids Steel and Owen. The “divide” column is of course the seat share divided by vote share. The formula to produce the score is a little arbitrary – to make the final numbers a little nicer (and perhaps more memorable) I have subtracted 1 from each answer in the Divide column then multiplied the result by 10.
| CONSERVATIVE | |||||
| Election | Parliament | Vote Share | Seat Share | Divide | Score |
| 1987 | 50th | 42.2% | 57.85% | 1.37 | 3.71 |
| 1992 | 51st | 41.9% | 51.61% | 1.23 | 2.32 |
| 1997 | 52nd | 30.7% | 25.04% | 0.82 | -1.84 |
| 2001 | 53rd | 31.7% | 25.19% | 0.79 | -2.05 |
| 2005 | 54th | 32.4% | 30.65% | 0.95 | -0.54 |
| 2010 | 55th | 36.1% | 47.08% | 1.30 | 3.04 |
| 2015 | 56th | 36.9% | 50.77% | 1.38 | 3.76 |
| 2017 | 57th | 42.3% | 48.77% | 1.15 | 1.53 |
| 2019 | 58th | 43.6% | 56.15% | 1.29 | 2.88 |
| 2024 | 59th | 23.7% | 18.62% | 0.79 | -2.15 |
| LABOUR | |||||
| Election | Parliament | Vote Share | Seat Share | Divide | Score |
| 1987 | 50th | 30.8% | 35.23% | 1.14 | 1.44 |
| 1992 | 51st | 34.4% | 41.63% | 1.21 | 2.10 |
| 1997 | 52nd | 43.2% | 63.43% | 1.47 | 4.68 |
| 2001 | 53rd | 40.7% | 62.52% | 1.54 | 5.36 |
| 2005 | 54th | 35.2% | 54.95% | 1.56 | 5.61 |
| 2010 | 55th | 29.0% | 39.69% | 1.37 | 3.69 |
| 2015 | 56th | 30.4% | 35.69% | 1.17 | 1.74 |
| 2017 | 57th | 40.0% | 40.31% | 1.01 | 0.08 |
| 2019 | 58th | 32.1% | 31.08% | 0.97 | -0.32 |
| 2024 | 59th | 33.8% | 63.23% | 1.87 | 8.71 |
| LIBERAL DEMOCRAT | |||||
| Election | Parliament | Vote Share | Seat Share | Divide | Score |
| 1987 | 50th | 22.6% | 3.38% | 0.15 | -8.50 |
| 1992 | 51st | 17.8% | 3.07% | 0.17 | -8.27 |
| 1997 | 52nd | 16.8% | 6.98% | 0.42 | -5.85 |
| 2001 | 53rd | 18.3% | 7.89% | 0.43 | -5.69 |
| 2005 | 54th | 22.0% | 9.60% | 0.44 | -5.64 |
| 2010 | 55th | 23.0% | 8.77% | 0.38 | -6.19 |
| 2015 | 56th | 7.9% | 1.23% | 0.16 | -8.44 |
| 2017 | 57th | 7.4% | 1.23% | 0.17 | -8.34 |
| 2019 | 58th | 11.6% | 1.85% | 0.16 | -8.41 |
| 2024 | 59th | 12.2% | 11.08% | 0.91 | -0.92 |
| COMBINED | ||||
| Election | Parliament | Conservative | Labour | Liberal Democrat |
| 1987 | 50th | 3.71 | 1.44 | -8.50 |
| 1992 | 51st | 2.32 | 2.10 | -8.27 |
| 1997 | 52nd | -1.84 | 4.68 | -5.85 |
| 2001 | 53rd | -2.05 | 5.36 | -5.69 |
| 2005 | 54th | -0.54 | 5.61 | -5.64 |
| 2010 | 55th | 3.04 | 3.69 | -6.19 |
| 2015 | 56th | 3.76 | 1.74 | -8.44 |
| 2017 | 57th | 1.53 | 0.08 | -8.34 |
| 2019 | 58th | 2.88 | -0.32 | -8.41 |
| 2024 | 59th | -2.15 | 8.71 | -0.92 |
It is striking that the Labour and Liberal Democrat lines are almost parallel throughout, while the Conservative line neither follows nor mirrors them. The Conservatives fell below the waterline during the Blair years, then were inconsistently high above it from 2010 to 2019, falling below again in 2024. The Labour party were always above except for 2019 (albeit very slightly). The Liberal Democrats have always been below, albeit very nearly touching this year. 2024 is also the first time that they have been less disadvantaged than the Conservatives were. Labour’s score in 2024 is of course a record high.

Pingback: The Political Colour Wheel | Robin Stanley Taylor